Python_(herschelhelp_internal)
xxxxxxxxxxMaster catalogue used: __master_catalogue_lockman-swire_20171201.fits__<br>Number of rows: 977,148<br>Surveys included:<br>| Survey | Telescope / Instrument | Filters (detection band in bold) | Location ||------------|-----------------------------|:------------------------------------------:|-----------------------------|| INT-WFC | INT/WFC | ugriz | dmu0_INTWFC | | RCSLenS | CFHT/MegaPrime/MegaCam | grizy | dmu0_RCSLenS || SpARCS | CFHT/MegaCam | ugrz | dmu0_SpARCS | | PanSTARRS-3SS | PanSTARRS/GPC1 | ugriz | dmu0_PanSTARRS1-3SS || UKIDSS DXS | UKIRT/WFCAM | J,K | dmu0_UKIDSS-DXS | | UHS | UKIRT/WFCAM | J | dmu0_UHS || SWIRE | Spitzer/IRAC MIPS | IRAC1234 & MIPS123 | dmu0_DataFusion-Spitzer | | SERVS | Spitzer/IRAC | IRAC12 | dmu0_DataFusion-Spitzer | Master catalogue used: master_catalogue_lockman-swire_20171201.fits
Number of rows: 977,148
Surveys included:
| Survey | Telescope / Instrument | Filters (detection band in bold) | Location |
|---|---|---|---|
| INT-WFC | INT/WFC | ugriz | dmu0_INTWFC |
| RCSLenS | CFHT/MegaPrime/MegaCam | grizy | dmu0_RCSLenS |
| SpARCS | CFHT/MegaCam | ugrz | dmu0_SpARCS |
| PanSTARRS-3SS | PanSTARRS/GPC1 | ugriz | dmu0_PanSTARRS1-3SS |
| UKIDSS DXS | UKIRT/WFCAM | J,K | dmu0_UKIDSS-DXS |
| UHS | UKIRT/WFCAM | J | dmu0_UHS |
| SWIRE | Spitzer/IRAC MIPS | IRAC1234 & MIPS123 | dmu0_DataFusion-Spitzer |
| SERVS | Spitzer/IRAC | IRAC12 | dmu0_DataFusion-Spitzer |
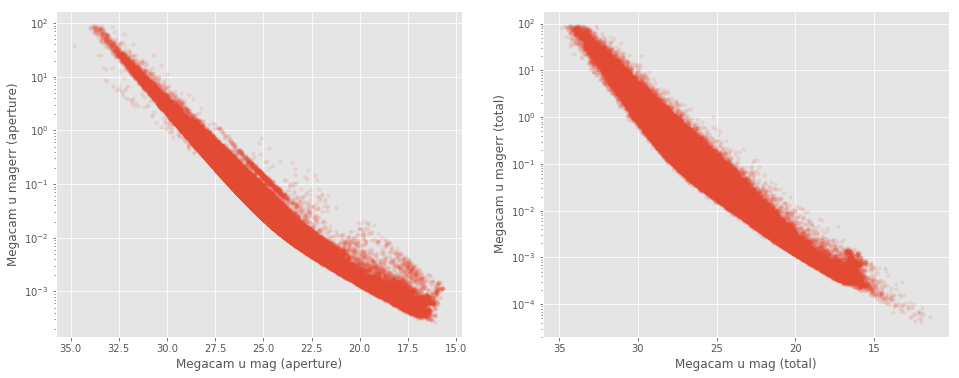
xxxxxxxxxxAt faint magnitudes (mag > 24), some surveys have very large errors on the magnitude. These objects may be unreliable for science puposes.<br>This includes __CFHT aperture and total__ magnitudes (at mag > 30), __PanSTARRS aperture and total__ magnitudes (at mag > 23) and __IRAC 12 aperture and total__ magnitudes (at mag > 26).<br><img src="help_plots/Lockman-SWIRE_magVSmagerr_Megacam_u_mag_total.png" />At
faint magnitudes (mag > 24), some surveys have very large errors on
the magnitude. These objects may be unreliable for science puposes.
This includes CFHT aperture and total magnitudes (at mag > 30), PanSTARRS aperture and total magnitudes (at mag > 23) and IRAC 12 aperture and total magnitudes (at mag > 26).
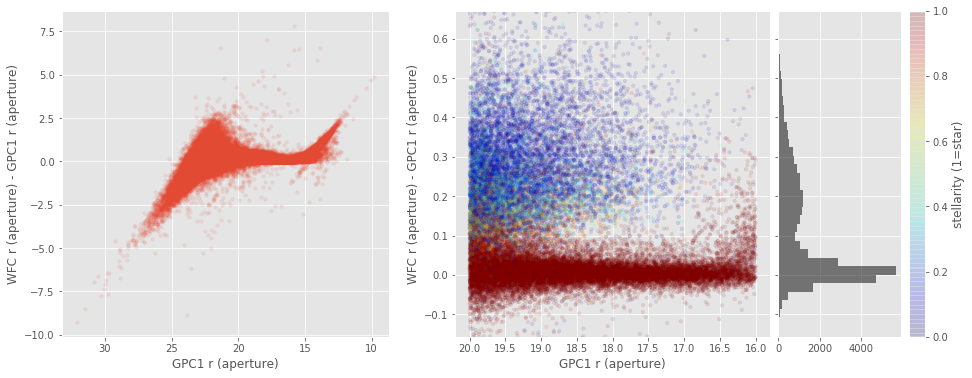
xxxxxxxxxxIn most of the case when comparing the aperture magnitudes between surveys, we observed a two peak distribution in the difference between the magnitudes ($\Delta_{mag} = mag_{survey1} - mag_{survey2}$). We have one peak around 0 for point-source objects, with a small spread. And a second peak at higher $\Delta_{mag}$ with a larger spread for extended objects; implying a different aperture correction between surveys for these objects.<br>That means that galaxies will not have the same aperture magnitude in different surveys. <br>In the ugriz bands, for bright sources, there is a two peaks distribution when comparing INT, CFHT and Pan-STARRS.<img src="help_plots/Lockman-SWIRE_apcorrIssues_WFC_r_aperture_-_GPC1_r_aperture.png" />In
most of the case when comparing the aperture magnitudes between
surveys, we observed a two peak distribution in the difference between
the magnitudes (). We have one peak around 0 for point-source objects, with a small spread. And a second peak at higher with a larger spread for extended objects; implying a different aperture correction between surveys for these objects.
That means that galaxies will not have the same aperture magnitude in different surveys.
In the ugriz bands, for bright sources, there is a two peaks distribution when comparing INT, CFHT and Pan-STARRS.
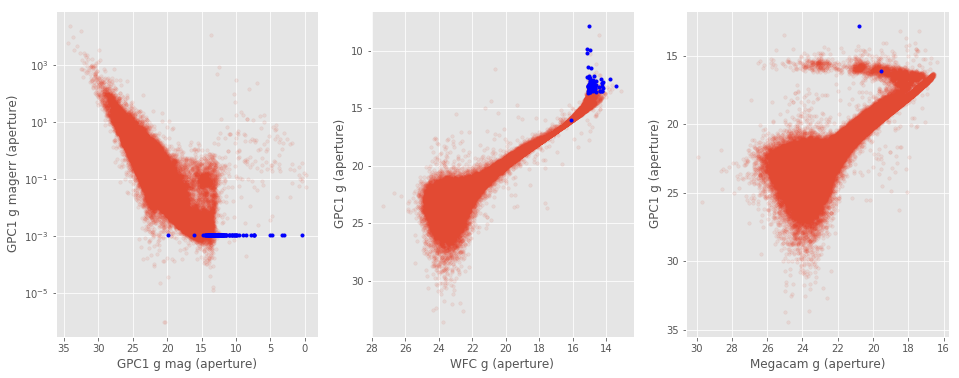
xxxxxxxxxx### II.a. Pan-STARRS aperture magnitudeFew Pan-STARRS sources have exactly the same error (of <font color='blue'>0.0010860000038519502</font>) on the __aperture and total__ magnitudes in all the grizy bands. The corresponding aperture magnitude should not be trusted for these objects.<br><img src="help_plots/Lockman-SWIRE_gpc1Issues_GPC1_g_mag_aperture.png" />Few Pan-STARRS sources have exactly the same error (of 0.0010860000038519502) on the aperture and total magnitudes in all the grizy bands. The corresponding aperture magnitude should not be trusted for these objects.
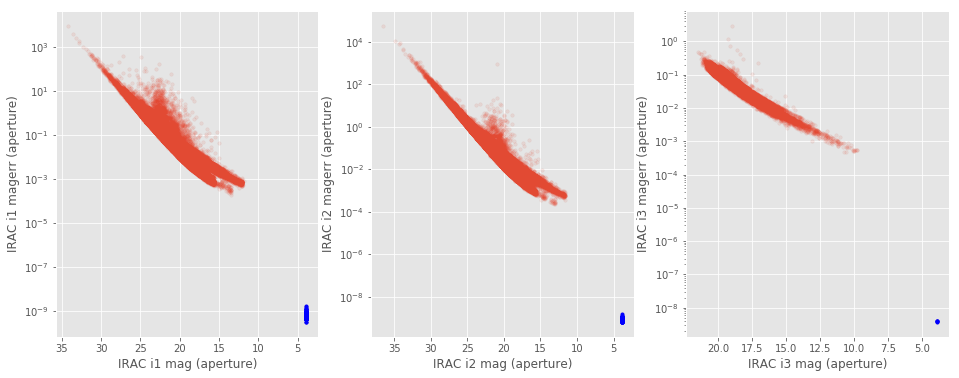
xxxxxxxxxx### II.c IRAC aperture magnitudeFew IRAC sources have exactly the same aperture magnitude (of <font color='blue'>3.9000000001085695</font>) in the IRAC1, IRAC2 and IRAC3 bands. These magnitudes also have extremely small errors (around 10$^{-8}$-10$^{-9}$). The corresponding magnitudes should not be trusted. <br><img src="help_plots/Lockman-SWIRE_iracIssues_i1_i2.png" />Few IRAC sources have exactly the same aperture magnitude (of 3.9000000001085695) in the IRAC1, IRAC2 and IRAC3 bands. These magnitudes also have extremely small errors (around 10-10). The corresponding magnitudes should not be trusted.
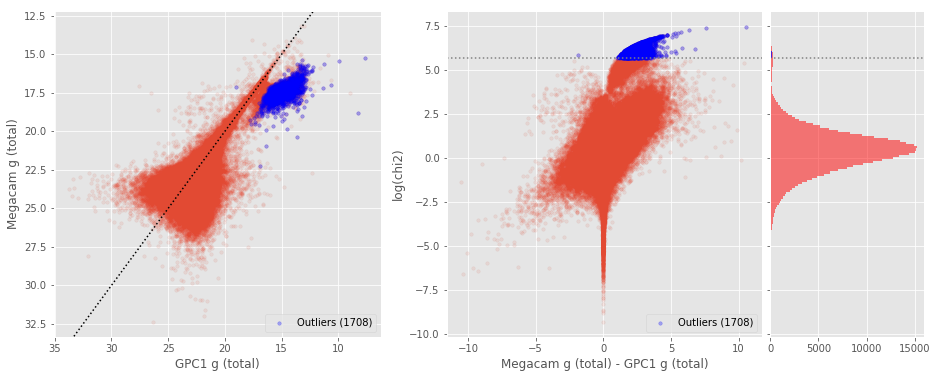
xxxxxxxxxx### II.b. OutliersBy comparing magnitude in the same band between different surveys, we can see that some magnitudes are significanlty different could not be trusted. <br>The outliers are identified to have a large weighted magnitude difference (equivalent of the $chi^2$).$$chi^2 = \frac{(mag_{1}-mag_{2})^2}{magerr_{1}^2 + magerr_{2}^2}$$ <br>We used the 75th and 25th percentile to flagged the objects 5$\sigma$ away on the large values tail of the $chi^2$ ditribution. (__NB:__ bright sources tend to have their errors underestimated with values as low as $10^{-6}$, which is unrealistic. So to avoid high $chi^2$ due to unrealistic small errors, we clip the error to get a minimum value of 0.1% (i.e. all errors smaller then $10^{-3}$ are set to $10^{-3}$).)<br><br>$$outliers == [chi^2 > (75th \;percentile + 3.2\times (75th \;percentile - 25th \;percentile))]$$<img src="help_plots/Lockman-SWIRE_outliers_Megacam_g_total_-_GPC1_g_total.png"/>By comparing magnitude in the same band between different surveys, we
can see that some magnitudes are significanlty different could not be
trusted.
The outliers are identified to have a large weighted magnitude difference (equivalent of the ).