Python_(herschelhelp_internal)
xxxxxxxxxxMaster catalogue used: __master_catalogue_elais-s1_20180122.fits__<br>Number of rows: 1,655,564<br>Surveys included:<br>| Survey | Telescope / Instrument | Filters (detection band in bold) | Location ||------------|-----------------------------|:------------------------------------------:|-----------------------------|| ESIS | ESO 2.2/WFI | BVR | dmu0_ESIS-VOICE || DES-DEEP | Blanco/DECAM | grizy | dmu0_DES || VIDEO | VISTA/VIRCAM | Y,J,H,Ks | dmu0_VISTA-VIDEO | | VHS | VISTA/VIRCAM | Y,J,H,Ks | dmu0_VISTA-VHS || SWIRE | Spitzer/IRAC MIPS | IRAC1234 | dmu0_DataFusion-Spitzer | | SERVS | Spitzer/IRAC | IRAC12 | dmu0_DataFusion-Spitzer | Master catalogue used: master_catalogue_elais-s1_20180122.fits
Number of rows: 1,655,564
Surveys included:
| Survey | Telescope / Instrument | Filters (detection band in bold) | Location |
|---|---|---|---|
| ESIS | ESO 2.2/WFI | BVR | dmu0_ESIS-VOICE |
| DES-DEEP | Blanco/DECAM | grizy | dmu0_DES |
| VIDEO | VISTA/VIRCAM | Y,J,H,Ks | dmu0_VISTA-VIDEO |
| VHS | VISTA/VIRCAM | Y,J,H,Ks | dmu0_VISTA-VHS |
| SWIRE | Spitzer/IRAC MIPS | IRAC1234 | dmu0_DataFusion-Spitzer |
| SERVS | Spitzer/IRAC | IRAC12 | dmu0_DataFusion-Spitzer |
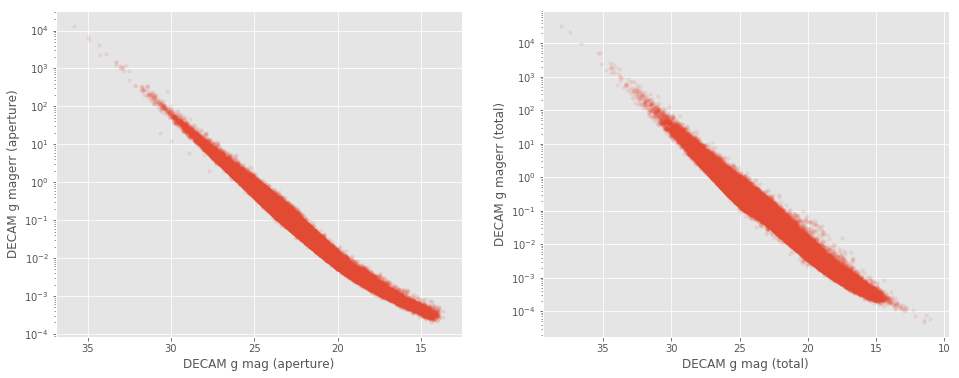
xxxxxxxxxxAt faint magnitudes (mag > 24), some surveys have very large errors on the magnitude. These objects may be unreliable for science puposes.<br>This includes __DES aperture and total__ (at mag > 24) and __VISTA aperture and total__ magnitudes (at mag > 20) and __IRAC1, IRAC2 aperture and total__ magnitudes (at mag > 20). <br><img src="help_plots/ELAIS-S1_magVSmagerr_DECAM_g_mag_total.png" />At
faint magnitudes (mag > 24), some surveys have very large errors on
the magnitude. These objects may be unreliable for science puposes.
This includes DES aperture and total (at mag > 24) and VISTA aperture and total magnitudes (at mag > 20) and IRAC1, IRAC2 aperture and total magnitudes (at mag > 20).
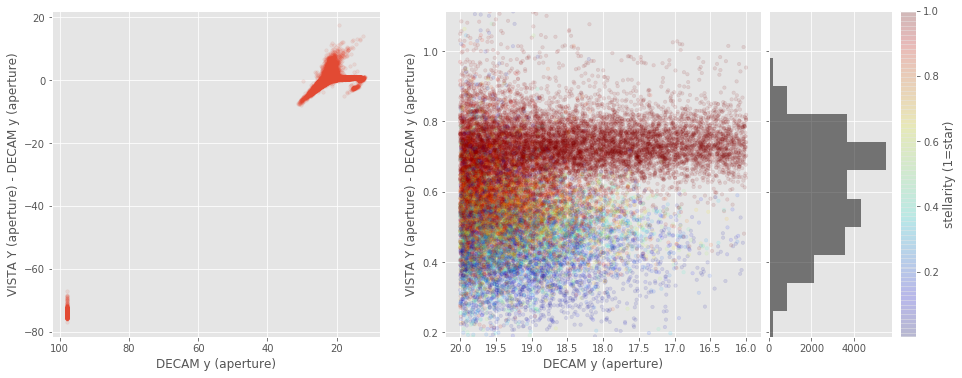
xxxxxxxxxxIn most of the case when comparing the aperture magnitudes between surveys, we observed a two peak distribution in the difference between the magnitudes ($\Delta_{mag} = mag_{survey1} - mag_{survey2}$). We have one peak around 0 for point-source objects, with a small spread. And a second peak at higher $\Delta_{mag}$ with a larger spread for extended objects; implying a different aperture correction between surveys for these objects.<br>That means that galaxies will not have the same aperture magnitude in different surveys. <br>In the z and y bands, for bright sources, there is a two peaks distribution when comparing DES and VISTA aperture magnitues.<br><img src="help_plots/ELAIS-S1_apcorrIssues_VISTA_Y_aperture_-_DECAM_y_aperture.png" />In
most of the case when comparing the aperture magnitudes between
surveys, we observed a two peak distribution in the difference between
the magnitudes (). We have one peak around 0 for point-source objects, with a small spread. And a second peak at higher with a larger spread for extended objects; implying a different aperture correction between surveys for these objects.
That means that galaxies will not have the same aperture magnitude in different surveys.
In the z and y bands, for bright sources, there is a two peaks distribution when comparing DES and VISTA aperture magnitues.
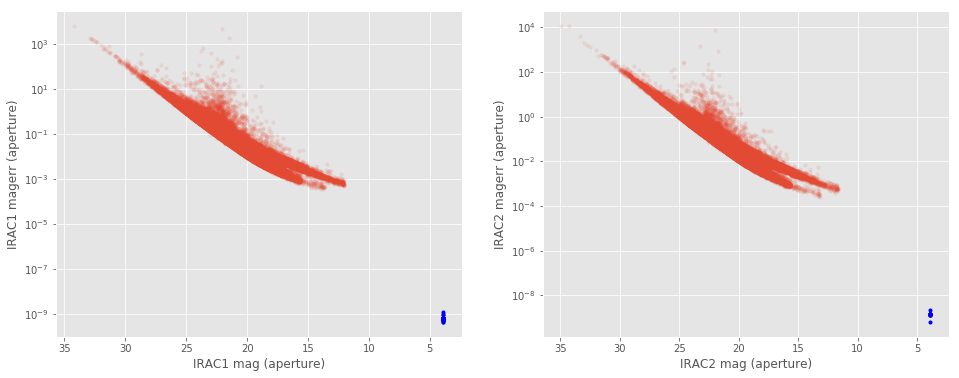
xxxxxxxxxx### II.c IRAC aperture magnitudeFew IRAC sources have exactly the same aperture magnitude (of <font color='blue'>3.9000000001085695</font>) in the IRAC1 and IRAC2 bands. These magnitudes also have extremely small errors (around 10$^{-8}$-10$^{-9}$). The corresponding magnitudes should not be trusted. <br><img src="help_plots/ELAIS-S1_iracIssues_i1_i2.png" />Few IRAC sources have exactly the same aperture magnitude (of 3.9000000001085695) in the IRAC1 and IRAC2 bands. These magnitudes also have extremely small errors (around 10-10). The corresponding magnitudes should not be trusted.
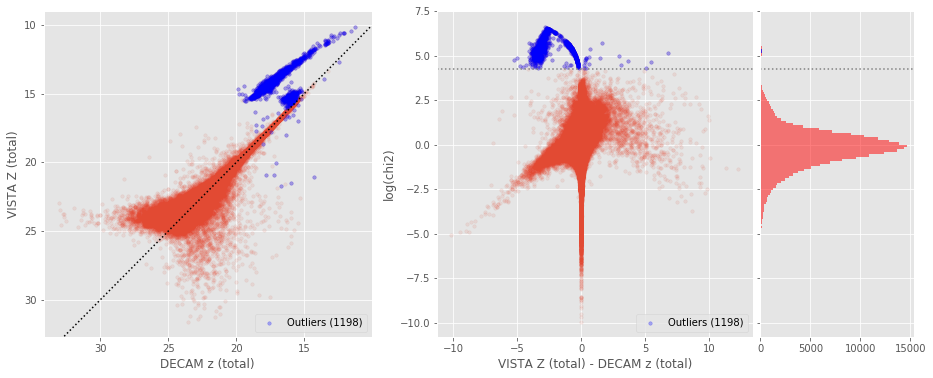
xxxxxxxxxx### II.b. OutliersBy comparing magnitude in the same band between different surveys, we can see that some magnitudes are significanlty different could not be trusted. <br>The outliers are identified to have a large weighted magnitude difference (equivalent of the $chi^2$).$$chi^2 = \frac{(mag_{1}-mag_{2})^2}{magerr_{1}^2 + magerr_{2}^2}$$ <br>We used the 75th and 25th percentile to flagged the objects 5$\sigma$ away on the large values tail of the $chi^2$ ditribution. (__NB:__ bright sources tend to have their errors underestimated with values as low as $10^{-6}$, which is unrealistic. So to avoid high $chi^2$ due to unrealistic small errors, we clip the error to get a minimum value of 0.1% (i.e. all errors smaller then $10^{-3}$ are set to $10^{-3}$).)<br><br>$$outliers == [chi^2 > (75th \;percentile + 3.2\times (75th \;percentile - 25th \;percentile))]$$__NB__: Only z and y bands of VISTA and DES are compared in this field, as DES is the only optical survey and VISTA the only NIR survey.<img src="help_plots/ELAIS-S1_outliers_VISTA_Z_total_-_DECAM_z_total.png"/>By comparing magnitude in the same band between different surveys, we
can see that some magnitudes are significanlty different could not be
trusted.
The outliers are identified to have a large weighted magnitude difference (equivalent of the ).
NB: Only z and y bands of VISTA and DES are compared in this field, as DES is the only optical survey and VISTA the only NIR survey.